Names have power. What we call a place, a person, a community, holds real power over them, both over their self-identity and how other people view them. When an explorer claims land for their mother country and begins to call it by name, it takes on an identity beyond the explorer’s mind. It becomes a part of a communal concept of the new culture, regardless of what the surrounding area thinks of it.
Many of the contemporary political issues in Southeast Asia, and indeed around the world, stem from names, and especially names on maps. There are two behaviors that trigger these problems: the impulse that people have to name things that they find, ignoring any names that may already exist for that thing, and the compulsive behavior of colonizers to draw arbitrary lines between themselves, disregarding the differences between the prior inhabitants of their new lands.
In this paper, I will introduce maps, touching both on what they have historically been used for and on some modern reinterpretations of the concept of a map. I will then move through the geography of Asia, the psychology of maps, and a quick introduction to the international relations of Asia. Next, I will bring together all of these topics, and discuss how Asia’s identity, such as it is, has been shaped and is shaped today, by the maps that are used in daily life. Finally, I will conclude with an analysis of the present-day state of borders and maps of Asia.
At its core, a map is a representation of some sort of data, projected onto a two-dimensional surface.1 They help us to think about where we are, where we are going, and who to get there, and we begin learning how to use them at a young age (Uttal, 2000). Despite their utility and importance to Western society, not every culture developed maps. For instance, the Australian aboriginal tribes use song as a mnemonic aid to describe the landscape along the paths through the deserts (Uttal, 2000).
Maps, especially those that do not fold, are difficult to preserve. The first maps, especially, were not created to last: one person would make them for a business exchange, and little thought was given to their future. The first recorded map is a Babylonian work, dated circa 600 BCE. Modern cartography is widely recognized to have begun in the Middle Ages,2 transitioning to computer-aided design in the 1970s.3 Because the earth is spherical, and maps are generally flat, the projection of the data from the model to the surface will be a lossy transition,4 and thus every map projection must make a different set of tradeoffs based around its intended audience. There are three basic categories of map projection: equivalent projections, which preserve area; conformal projections, which preserve angles; and compromise projections, which guarantee neither but instead focus on making an aesthetically pleasing map.
Gerardus Mercator created the Mercator projection (a conformal projection) in 1569. Designed for sailors, its tradeoffs correspond with navigational issues: it allows you to draw a straight line between two points, and sail between them by maintaining a single heading. It also maintains the shapes of the coastlines, again for sailing. Because of that, though, it sacrifices the relative sizes of the continents, magnifying land masses near the poles at the expense of the equatorial areas.5 This is the complaint most commonly levied at the Mercator projection: that because it emphasizes the traditionally power Western nations, it disenfranchises the newer, third-world nations, and inflates the self-worth of the Western powers.6
James Gall designed the Gall-Peters projection (an equivalent projection) some 250 years later, in 1855. Designed to show both the proper sizes and shapes of the worlds landmasses, at the expense of the straight lines, which was an acceptable tradeoff as it was not aimed at sailors and navigators but rather intended to educating people on the proper sizes of continents. Arno Peters independently developed an identical projection in 1967, and promptly spent the rest of his life annoying the cartographical community with claims of being the sole inventor. He did succeed in raising social awareness of the issues with the Mercator projection, by dint of promoting his projection at the time of the rise of awareness of social issues, but some of his other claims—especially his claim of being the only area-correct map7—enraged a large portion of the cartographic community.
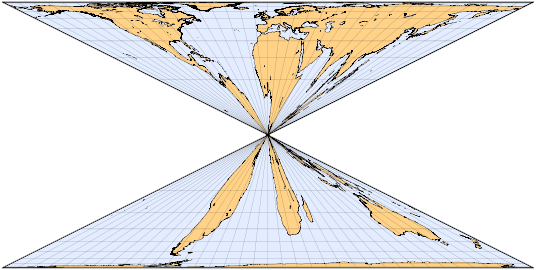
John P. Snyder, fed up with the debate about the benefits of the Gall-Peters projection, which hinged primarily on the fact that it was accurate in the relative size of the landmasses (areal preservation), created the Snyder projection (an equivalent projection) to prove that areal preservation alone does not make a good map.
The late twentieth century, and the advent of computer-based modeling, led to an increase in the number of intriguing projections, as cartographers created new derivatives of older works. In 1996, Steve Waterman created the Waterman butterfly projection (a compromise projection) from the work of one Bernard J. S. Cahill, who patented a “Butterfly Map” in 1913. These maps are intended to accurately show all of the continents uninterrupted, while keeping them relatively close to their actual locations on a globe.8
The Natural Earth projection (a compromise projection) is a part of the Natural Earth project, started by Nathaniel Vaughn Kelso and Tom Patterson in 2009, with the intent of providing a small-scale dataset of the shape of the world.9 It derives from two other projections, the Robinson and the Kavraiskiy VII, but allows more space near the extreme latitudes to show coastal detail.
Today, Britain and UNESCO both advocate the use of the Gall-Peters projection,10 which is a nice change from the traditional use of the Mercator. Geographers have been fighting the Mercator’s place in education since at least 1943, as seen in this editorial from the NYT:11
The time has come to discard [the Mercator] for something that represents the continents and directions less deceptively... Although its usage... has diminished... it is still highly popular as a wall map apparently in part because, as a rectangular map, it fills a rectangular wall space with more map, and clearly because its familiarity breeds more popularity.
Every map is an inherently flawed and biased mechanism for locating our place in the world. Most of the available research focuses on the impact of the Mercator projection on Africa, rather than in Asia, but we can draw parallels between some of the African struggles and Southeast Asia.
Entire papers have been written on definitions of Asia, from among many perspectives. I will be focusing on only a few aspects of Asia-ness: the geographical boundaries and the political issues that arise from them. What, then, is Asia? Is it the continent, whose name seems to derive from the ancient Greek term for what is now western Turkey?12 Is it a common set of people? A common religion? Are there any cultural or geographical commonalities shared amongst all the Asian communities? One defining trait of all of the countries in Asia is that the identity of their inhabitants is not “Asia” or “Asian,” but instead that of whatever state they hail from. Any “Asian” characteristics that they exhibit were developed solely as by dint of being “not European.” Even so, that is enough of a feature to outline a concept of Asia.
Even a simple map of the Asian continent can provide strikingly different visual stimulus, depending on the projections used: compare the four projections here, all centered on Taiwan.13
As such, the distortions of a given projection can mislead people’s thinking about geographical spaces and even muddle their thoughts about international relations. They have an essential but potentially confounding effect on any and every geopolitical environment around the world. Compare the implied sizes of China and Greenland on the Mercator projection, for instance. Moreover, consider the implications of teaching generations of schoolchildren in the Western hemisphere about geography with such a map, over-inflating the sense of self-worth of those countries.
I conducted a short survey of St. Olaf students and faculty, asking them to answer the question: What is Asia?14 I made a visualization of the data, plotting the percentage of votes that each country received on a world map. The tabs along the top allow you to view only the responses from people of a given country.
Of the 113 people who responded to my survey, all of them agreed that some countries were Asian.15 The divide votes for rest of the countries expanded outward in concentric rings from the unanimous center.
Given this divide in what constitutes Asia, let us think about Asia as a concept, rather than a geographical region. Who has power in such a place? What attracts world powers to the area, and are there any commonalities between the members of this “imagined” community?
Certainly, the world powers who are geographically in the Asian region are a part of Asia: China, Japan, and so forth. Other world powers, too, especially ones with thousands of troops constantly in the region, should probably be included, as their presence affects the politics of the region. In Southeast Asia, especially, smaller countries have banded together into regional organizations such as ASEAN.16 Jame Scott would be throughly put out with us if we didn’t mention Zomia,17 and whatever will we do with Australia? If we consider alternate viewports into maps of the globe, we can potentially answer some of these questions.
When we reposition the map such that America is in the center, rather than on a side, we see that it is now plausible to consider China and most of East Asia to be our neighbors.
If we look at a map with China in the center, which is a popular variant within China,18 we can see that China is strategically located: Europe on one side, America on the other, and plenty of nearby ocean to trade across.
When we look at MacArthur’s Corrective Map of the World,19 the world is suddenly ocean, with China at a prime location to take advantage of the possibilities of trade.
By simply adjusting the rotation and center position of the map projection, we have demonstrated that our mental cartographical systems are not independent of the maps that we see. This raises an important question, though: how do the maps we interact with as children affect how we see and use them as adults?
Our brains constantly maintain a mental index of the places of objects around us, relative to our position in the world. There is a subset of psychology that focuses on the study of these spatial environments, called spatial cognition. It includes the acquisition, utilization, internal organization, and maintenance of our knowledge about the areas around us, and it shows us how maps affect our mental processes and therefore how we interact with the world represented by the maps.
When do children learn what a map represents? How long does it take before their mental processes are advanced enough to understand the abstract notions implied by symbols on pieces of paper?
[One] kindergartner said that a red line on a map could not represent a road because no roads are red in the world … Another said that the representation of a road could not be a road because it was too narrow to accommodate a car.20
There are three major elements to spatial thinking:21 knowing about the concepts of space, understanding spatial representations, and grasping spatial reasoning. No map can accurately represent everything about the real world; therefore, information is abstracted away with the placement of symbols onto the map, and the child must be able to understand that the symbol does not literally exist in reality, but instead references something else that is actually present.
Not only do children have trouble understanding that something can stand in as a reference for something else, they also struggle to understand the existence of “representations” as a class of object. Furthermore, once they grasp the concept of a representation, they expect that the representation and represented object share almost every quality—such as the three-year-old children who expect a photograph of a rattle to make noise when shaken.22 They also need to develop the ability to understand that a map itself is a reference to a section of the world: since every map has an inherent viewing angle and viewing direction, they must grasp how an object can be “projected” onto another surface. Before they develop those skills, they must rely on what are known as “topological spatial concepts,” qualities that do not change even when the object is distorted.
Research has found that groups of children in kindergarten begin to understand abstract top-down views of familiar environments, such as their classroom, when the map is aligned with their viewpoint.23 When the map was 180˚ out of alignment with the rest of the room, they could not yet comprehend the change in direction. From the same study, by the time children are in the second grade, they have generally mastered all of the abilities except for alignment of the map with the physical area; by the time they reach the fifth grade, they have also achieved that ability.
Another group performed a study on how perceived distance affected undergraduate students’ emotional attachment to places, and specifically how different map projections affected that perceived distance.24 They gathered a group of men and women from Columbia, South Carolina, and showed them four maps.
Their research showed that women had a higher sense of emotional entanglement than men, and that all subjects expressed significantly higher emotionality when viewing the map centered on the United States (map B). Cities in North America were ranked higher across the board than those on other continents, with European cities coming in second. They also attempted to answer the question, “Does relative map-distance affect people's emotional involvement with places?” They found that, with the exception of Hong Kong, every city ranked higher when it was located closer to them. We now know that, at least in North America, people are more emotionally involved when they see themselves as being in the center of the world.
[These findings] underscore the role played by maps in communicating with people about places in the world and the importance of how those maps are designed. When children grow up in classrooms where maps in their textbooks and on the wall are based on projections that greatly exaggerate relative global distances, does this contribute to their being less interested in some places than in others? The same question can be asked about the projections used by newspapers to show the locations of world events.
There are also cultures who have never developed maps of any sort. Take, for instance, the navigators of the Caroline Islands, in the Pacific:
The native navigators’ conceptions of space are fundamentally different from the Western, map- or chart-influenced conceptions. They imagine themselves to be part of the space. The position of the canoe is assumed to be fixed, and the navigators imagine that the stars and islands float past it. In contrast, modern, Western navigators conceive of space from above, as something that can be looked down upon and inspected, partly because of their experience in using maps.
Another alternative to traditional maps comes from the aboriginal people of Australia, who navigate with the aid of mythological mnemonics about the very path that they take through the desert:
The aborigines do not conceive of their journeys in terms of fixed, metric distances. Rather, they remember and describe the journeys in terms of progress along a particular songline. As in the previous example regarding the Pacific navigators, [they] are able to navigate successfully without recourse to the Western, map-influenced model of large-scale space.
Regardless of what other cultures have developed, maps are an essential part of our navigational process, and we must fight the misconceptions that the imperfect projections leave us—for instance, the thought that Greenland is larger than China. Even when we look at the Southeast Asian countries, though, which are close to the equator and thus do not suffer from relative distortion between themselves, the maps still divide people with somewhat arbitrary borders.
The international relations of Asia are many-faceted and constantly changing. One book on the topic required a new edition only six years after the prior edition’s release. There are at least six dimensions to these relationships—systemic ones, that affect all countries; sub-regional, which only affect certain regions; functional, when some countries take issue with others; fixed characteristics, such as geography; historical, since memories last a long time; and finally, the norms of the states themselves, which constantly fluctuate.25
There are about as many multilateral organizations in Asia as there are countries, although none with the same clout as the European Union. The United States also has several bilateral relationships in Asia. There are growing separatist movements in several countries. No country has yet properly subjugated the hill people of Southeast Asia. 60% of the world’s population lives in Asia. Together, these factors make for a muddled morass of relationships that every country must navigate.
Additionally, these are only the modern borders. Since WWI, only forty-four changes have happened too the internationally recognized borders in Asia. However, border changes do not always change who lives there, nor do they necessarily create more accurate demarcations between groups. Some Asian states have maintained their identity, if not their exact borders, since their founding—and the average date for the last border change is in 1797.26 Despite this relatively low rate of border change in Asia, there are still a large number of border disputes ongoing today, most notably between India many of its surrounding states and between the two halves of Korea.
Luckily, the beginning of colonialism did not come about in the same manner as in Africa, with the story of European leaders drawing borders on the wall map. Instead, and likely thanks to the quantity of island nations, the colonized nations mostly retained their extant borders. This was both fortunate, because the established hierarchy of countries essentially remained unchanged, and unfortunate, because the minority ethnic groups remained mired in their substandard political climates, as no new states were carved out for them.
Looking at the borders of the Republic of Korea vis-à-vis the Democratic People’s Republic of Korea, there were two notable changes. One was the formation of the two countries, when the United States and the Soviet Union each took half of the kingdom under their respective wings; the other came after the Korean War, when brother fought brother until the Korean Armistice Agreement was finalized three years later. The border today lies close to the original location, near the 38th parallel, divided after more than a millennium of a united Korea. The suddenness of the handover from Japanese to US/Soviet control left families split across the divide, most of whom remain separated today.
Examining the division of land of India vis-à-vis Kashmir and Pakistan, we see a different source of antagonism, but much of the same result, of divided families. The Pakistani border was divided by a simple religious majority, which left not only families divided but also left believers in a place where they were not a part of the majority religion. The root cause of most of the fighting across the border today stems from the territory known as Kashmir, which both countries claim. This fight has no clear resolution in sight.
A somewhat different situation exists vis-à-vis the People’s Republic of China and the Republic of China, where there is still a significant amount of freedom to travel between the two countries, as they both claim to be the rightful government of the entirety of China. Ever since Taiwan’s ROC government was removed from the UN Security Council, its position in the world has waned, but not its sense of importance.27 As with most disputed governments, neither truly wants to provoke the other into open warfare, so they both sit quietly, biding their time. James Scott also talks about the conceptual region of Zomia, a conglomeration of the highland tribes of Southeast Asia. It is one of the last large sections of the planet to not be controlled by nation-states, although the advent of modern technology is bringing even that era to a close, primarily through the PRC’s advance through the mountains.
Looking back on Asia, across cartography, childhood development, international relations, and geography, I remain convinced that maps, and especially their labels, are problematic for any cultures that have to share a demarcated space, especially if those cultures have historically been nomadic.
Names impose an identity, which is fine. However, the newly-named thing may well already have a distinct identity, and it is difficult to integrate two completely disparate identities, because although people normally have more than one identity,28 those identities are created by the person themselves, rather than by the discoverer or colonizer. When the finder imposes a name onto something, that name begins an entirely new identity for the named thing, rather than integrating as a new facet of the thing’s identity.
A judicious redrawing of borders would be an interesting thought experiment, but would never work in the real world. A simpler approach, which might bring some of the same benefits, would be to encourage the world to expand its approach to mapping education, to show students that no country is the center of the world, nor of civilization.
There could be other reasons for the number of wars happening around the world, beyond having been colonized and reidentified; they could all just be religious wars; they might be fighting just to fight; or they might simply want the United States to quit poking our nose in everyone’s business. Regardless of the actual reason, I firmly believe that many of today’s wars stem directly from the period of European colonization. While they may not have been spawned by naming arguments, it is assuredly a factor.
Names are powerful, and we should both accept responsibility for our past careless use of that power and take additional care to avoid similar harm to other people in the future.